
Sometimes we forget that a pencil is technology, an idea easily lost in this age of electronics constantly at our fingertips, and computers in every classroom. But a good pencil or pen, with its tactile connection to our brain, can be a useful tool for learning to informally assemble information from small datasets, picture relationships, and glean ideas without the constraints of pre-programmed graphing applications.
Graphing by hand is a powerful strategy for learning, and for teaching. Students gain several skills when they first learn to draw a graph by hand.
- They learn to draw and label axes to scale (which graphing applications do automatically for them). We encountered plenty of examples where students did not scale axes properly:

What is the relationship between mercury in muscle tissue and fish weight?
What is the relationship between age and the concentration of mercury in hair?
- Students can learn how a graph is constructed, such as what defines the position of the box and the length of the whiskers in a box plot.
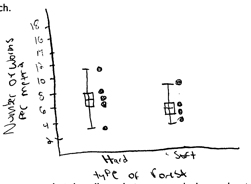
How do hardwood and softwood forest sites compare in the number of earthworms found in each?
- Students have full ownership of the ultimate product. Their graph provides a window into how they think about data as they select information from a table and decide how to represent it visually so it can answer a question.
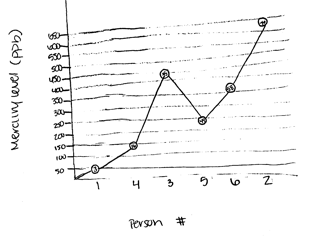
In the last way, hand drawn graphs are useful to teachers for formative assessment. Here is a graph drawn by a student that could not have been made with graphing software.

Although the student plotted the points correctly using reasonable axis scales, he or she labeled the fish numbers and connected the points in the order they were listed in the data, suggesting that they don’t know when it is appropriate to connect points in a scatter plot. He or she is probably thinking about the data more as individual points, rather than recognizing a pattern of relationship among the individuals in the group.
This 7th-grader probably does not yet fully understand how two-dimensional XY space works.
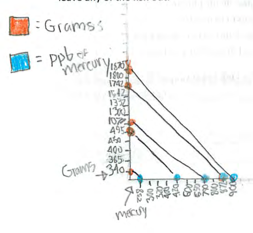
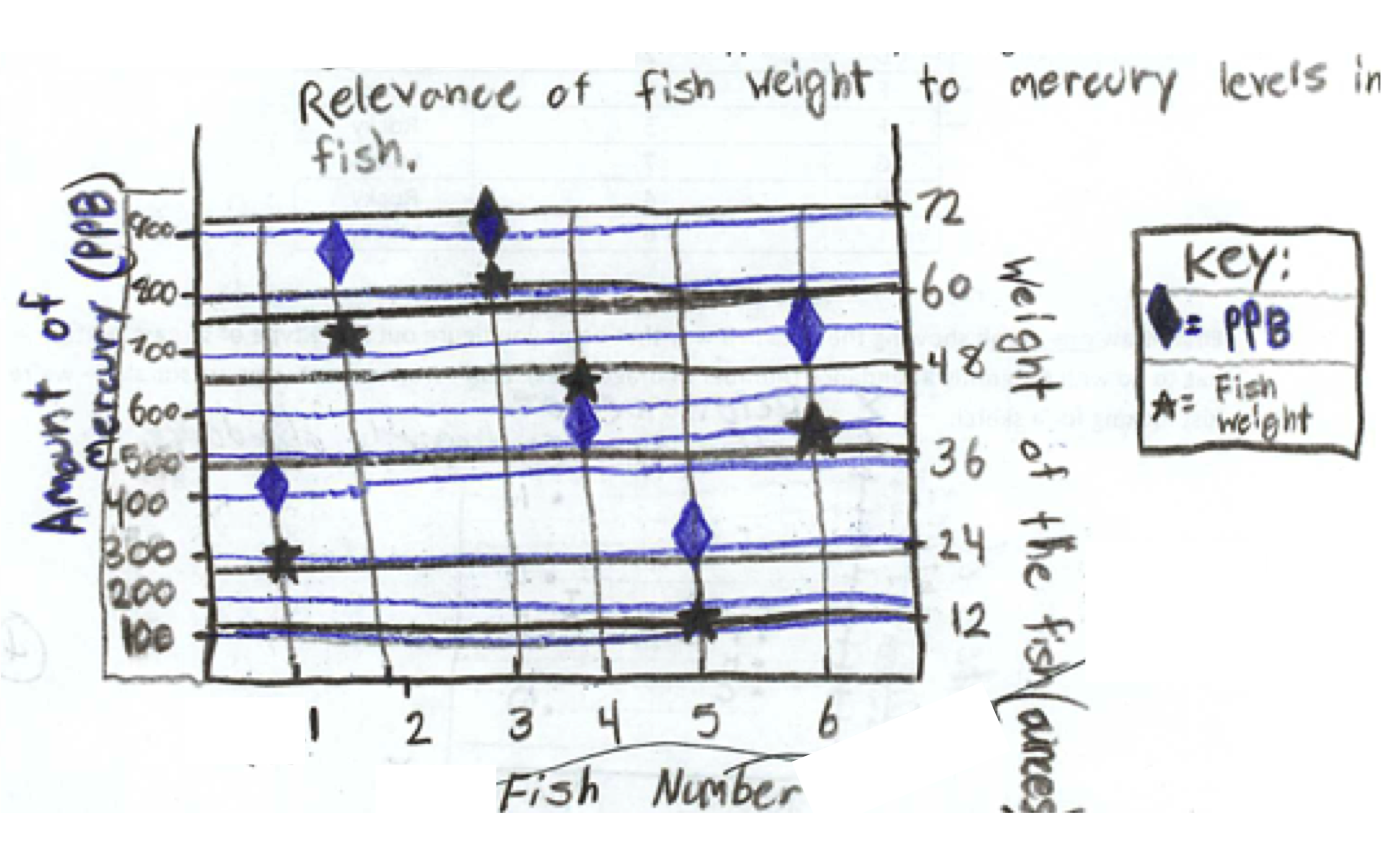
Graph the data in a way that helps you decide if there is a relationship between fish weight and mercury in muscle tissue.
Students often try to hedge their bets when graphing and include as much information as possible, perhaps hoping that at least some of it will be correct. This student might benefit from practice deciding with information is needed and which is not needed to answer a given question.
You might have noticed that all of the graphs here are drawn on blank white paper, with no grid lines. While there are times that call for providing grid lines, we found that even the presence of pre-made grid lines can distract students from thinking originally and freely about the best way to graph data. Adhering carefully to the grid squares often becomes more important than the overall form and message of the graph.
Don’t forget the technology of pen or pencil! See what you can learn about your students by giving them only set of colored pencils and their thinking and imagination to rely on.
