

public domain photo by Ken Thomas
Over the past few years, web-based tools like Tuva and CODAP have made it easy for students to explore data in intuitive ways that keep them focused on what the data have to say rather than on spreadsheet mechanics. Many teachers use these tools with curated, fully-prepared datasets. But these tools can also be used to explore data that the students have collected themselves. However, we have found that many teachers encounter difficulty in organizing student data to work well with Tuva or CODAP. In this post, we use a hypothetical student study of birds on feeders to illustrate the issue and how to address it.
Suppose that, after observing finches at four feeders around the school, students felt that there might be more activity at some of the feeders than at others. They also observed that the finches would often land on a feeder, grab a seed, and fly off to the shelter of nearby trees. Sometimes there were a lot of birds around the feeders, coming and going. But it could also happen that no birds were on the feeder at all.
To test their idea that, even with this coming and going, some feeders got more use than others, the students designed a protocol where they would go out to the feeders eight times each day and count the number of individual visits to each feeder over a period of five minutes. They defined a visit as a finch landing on the feeder. They knew that a “visit” might be the same bird coming back for another seed, but they decided that this didn’t matter since they were really interested in the amount of activity on each feeder and, besides, telling different finches apart was really difficult.
After adding up the number of visits for each day, they created a table that looked like this. (Again, this is a hypothetical study that we created — not real data — to show you some important things about organizing data.)
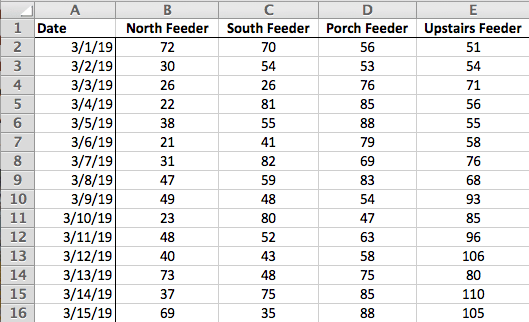
Figure 1. The way that most teachers and students organize data with two independent variables (in this case, “Date” and “Feeder Location”) and one dependent variable (“Number of Bird Visits”).
In our experience, this table is organized the way most teachers and students would go about summarizing daily totals. The forms used to actually collect data during each observation session would be different, probably using tally marks to keep track of bird visits by fives and perhaps also recording the date of observation, the time that observation began, the time that it ended, and perhaps some other things. But, when adding up the tallies for each day, it is likely that the summary table would use a new row for each day and would use different columns to record the daily totals for each feeder, much like the table illustrated above.
Data visualization tools like Tuva and CODAP will read in a table organized this way, but what they can do with data will be disappointing. Notably, the tools will not be able to create a graph such as the one below that actually answers the students’ question. (We produced this graph using Tuva.)
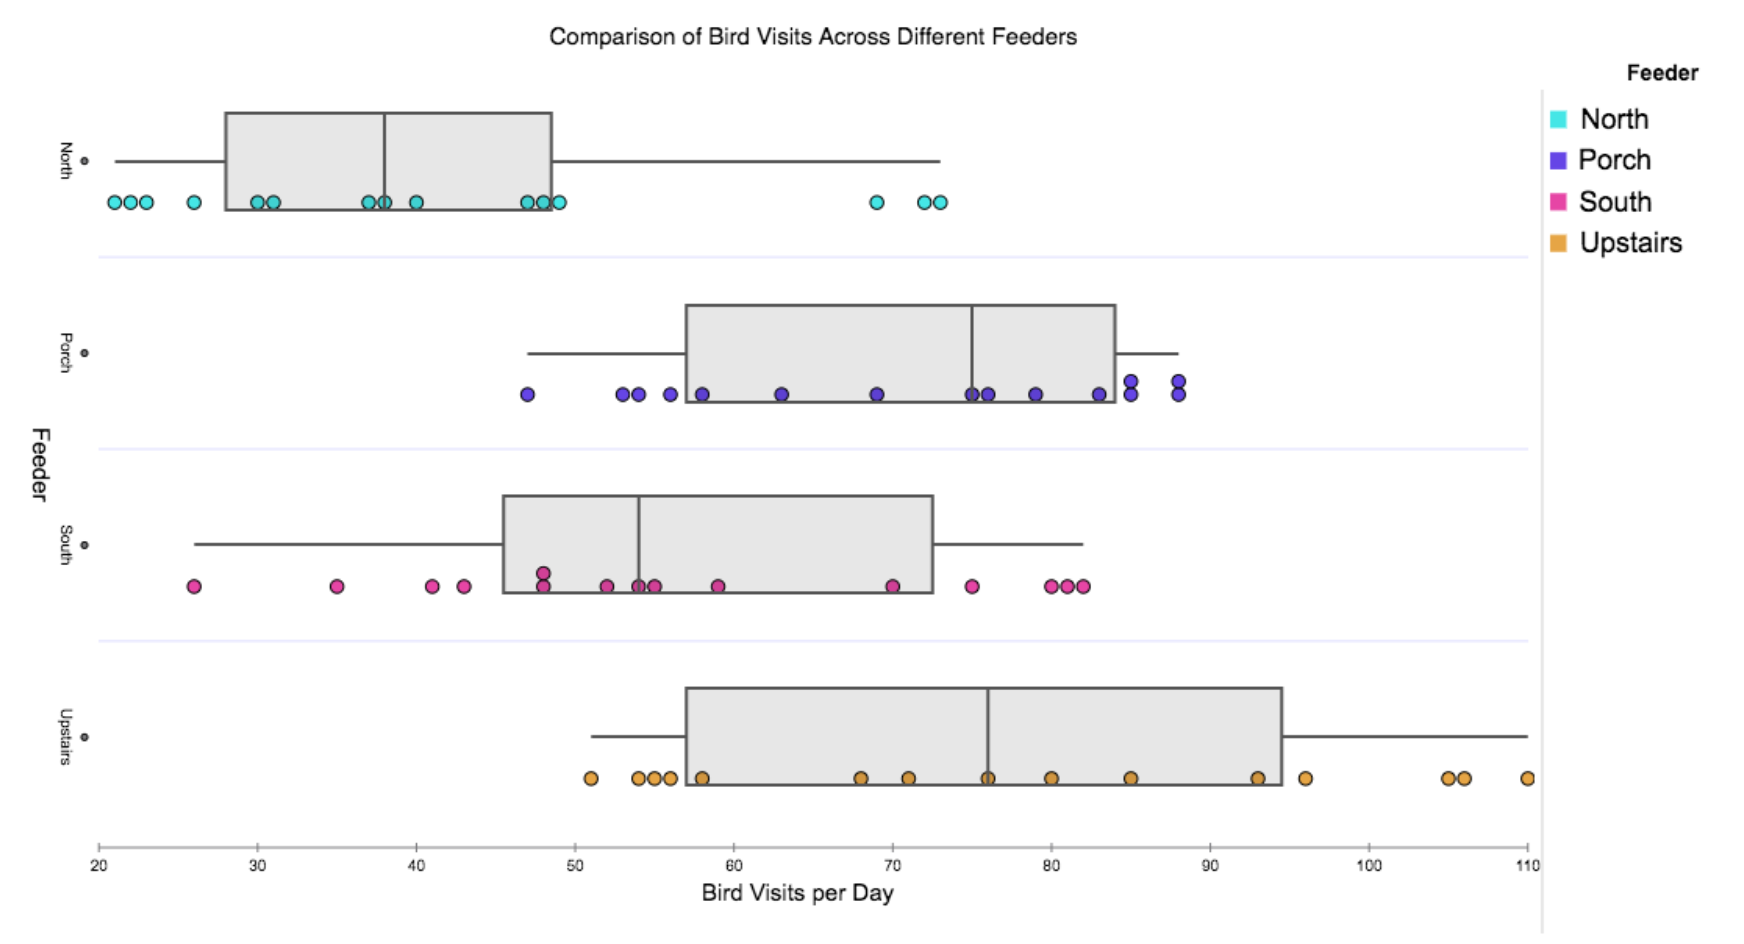
Figure 2. Graph that answers the students’ question, but that cannot be produced by importing the table in Figure 1.
The reason that neither Tuva nor CODAP can create a graph like this from the table in Figure 1 is simple: the table in Figure 1 does not actually identify the variable used to hold the counts of “Bird Visits per Day.” Yes … the numbers for the visits per day can be found in the table, but they are listed under variables titled “North Feeder,” “South Feeder,” and so on. As human readers, we can infer that these numbers must be the counts of bird visits. But computers do not make inferences. They need us to identify an actual, stand-alone variable that will be used to hold the values for bird visits. Perhaps the easiest way to make this idea clear is to show you the kind of data table that DOES work well in Tuva or CODAP.
How the Data SHOULD be Organized
The table below shows how the data should be organized for important into Tuva, CODAP, or similar tools in order to do the kind of analysis that can answer the students’ question (along with other interesting questions).

Figure 3. Data table organized for use with Tuva or CODAP that includes a variable for bird visits.
Note that we now have a column named “Bird Visits per Day.” This tells the data visualization software that we want to have a variable with that name that we can use in a graph such as the one in Figure 2. Also note that this table has a variable called “Feeder” that can have one of four values, each corresponding to one of the feeder locations. (When a variable is categorical — meaning that it can only have a pre-determined number of values — it is often called a “factor.” In this example, the location of the Feeder is a factor that is associated with changes in the distribution of the number of bird visits as shown in Figure 2.)
Finally, note that rather than having just one row for each day, there are now four entries for each day, each entry corresponding to one of the four feeder locations. Reorganizing the table in this way, where every one of the 60 daily totals now gets a row of its own, results in a tall, narrow table. Figure 2 only includes entries for the first five days (5 days x 4 rows per day = 20 rows); we did not show the entries for the other ten days to keep the figure from filling up your entire screen. Here is a link to the entire table if you would like to see the whole thing.
Independent and Dependent Variables
The Common Core Mathematics Standards suggest that students should be introduced to the ideas of “dependent variable” and “independent variable” in sixth grade (CCSS.MATH.CONTENT.6.EE.C.9). Our experiences across many classrooms suggest that, in fact, most teachers and students in middle and high school classes are comfortable with and use these terms. One of the nice things about organizing the data as shown in Figure 3 is that it supports and reinforces student thinking about independent and dependent variables in the context of their own experiments. In the case of this bird feeder investigation, the dependent variable–the count of bird visits that the students are using as a measure of bird activity–is the column on the right. The first two columns are the independent variables that might be associated with variation in the amount of bird activity:
- Date – Enables students to track day-to-day changes in bird activity.
- Feeder – This variable, or “factor,” is at the heart of the student’s research question: Is there more activity at some feeders than at others?
Finally, note that when your students are working in Tuva or CODAP, these tools just refer to each column in the dataset as an “attribute” rather than as variables, dependent variables, and so on. The reason for this is that the details of the design–such as what you consider to be dependent and independent–are up to you. (For example, in a more complicated analysis you might have a number of dependent variables for which you and your students are collecting data in response to different factors.)
Summary
- The way you organize your data needs to reflect the question you are trying to answer. If the question is of the form, “Are changes in thing X associated with a change in the values of thing Y?” your investigation is looking at how a dependent variable (Y) changes in response to different values of an independent variable (X).
- To do this kind of analysis, you need to organize your data so that Y (in this example, the number of bird visits) has a column of its own in your data table. (Or, in the terminology of the analysis tools, is an “attribute” that you can drag and drop into a graph.)
- Every instance of the dependent variable gets a row of its own
- The values of the independent variables (in this example, of Date and Feeder) in each row are matched to the dependent variable value. (So, the Bird Visits per Day is matched to a specific Date and Feeder value.)

Thanks for this useful information.