
Find the header below that describes the type of data skills you are looking for.
Scaffold the process of data analysis
Strategies and guidance to help students make their own decisions as they analyze and interpret data.
- Think your way through data analysis (One-page reference handout for students)
- Think your way through data analysis – Teacher Guide (Guide with more details for teachers or older students)
- Prompts for guiding students through data analysis (One page, for teachers, language for prompting students to think as they analyze data, adaptable for students)
Organize data in tables and spreadsheets
Support for learning how to organize data in tables and spreadsheets for different purposes.
- Organizing Student Data for Computer Visualization
- Organizing data for analysis: two approaches
- Graphing in spreadsheets vs. graphing in Tuva
Ask Questions
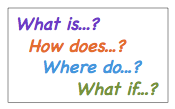
Strategies for helping students frame clear questions that can be answered with data.
Core skill: Describe variability & distributions
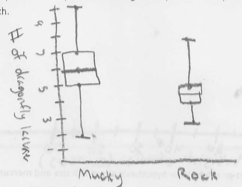
Materials in this section can help students learn to think about qualities of groups instead of pointing to single data points, create and describe data in distributions (dot plots, box plots, and histograms), and reflect on what can be learned about populations or phenomena by looking at how they vary.
- Key ideas for statistical thinking (Instructional slides)
- Show and describe variability in a distribution (Instructional slides)
- Language for describing distributions (two-page downloadable handout in GDrive)
- Intro to Distributions: Old Faithful Lesson Plan (Lesson plan in GDrive, introduces dot plot)
- Scale an axis and make a dot plot (How-to slides, construct a dot plot by hand)
- From dot plot to box plot (How-to slides, construct a box plot starting with a dot plot)
- Anatomy of a box plot (Instructional slides explaining the different parts of a box plot)
Graph data to address a question or claim

- Graph Choice Chart (Maine Data Literacy Project)
- Graph Choice Chart Teaching Guide
- What kind of question? What kind of graph? (One-page practice worksheet)
Kinds of analysis
- Compare Groups Practice: Chromosome numbers in plants and animals
- Language for Comparing Groups
Communicate a data story

Assess data literacy skills
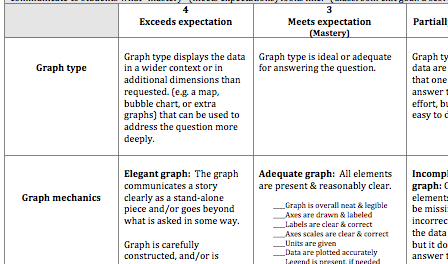
- Rubric for graphing and interpretation: A two-page PDF file with does not meet, partially meets, meets, and exceeds criteria for creating hand-drawn graphs and interpreting them.
