

Are you wondering what kinds of data skills and ideas your students could be developing in your classroom?
The value of students developing data literacy is becoming recognized across disciplines, from STEM subjects to social sciences and even in language arts, with emphasis on communicating ideas and developing arguments. Despite the enthusiasm, deciding how to build data literacy as part of classroom instruction challenges many educators.
Teachers, researchers, and other educators are raising interesting questions about how to engage students with data: What are students thinking when they work with data? What supports their development of data skills? What does effective teaching of data literacy in classrooms involve? What role should technology play? What kinds of data-related tasks are appropriate for students at different stages of learning?
If you are a teacher wondering especially about the last question, you are not alone. Even though math texts and learning standards include specific skills in “data and measurement” and “statistics and probability”, and NGSS standards incorporate science practices that are components of data literacy, many teachers still wonder: What, exactly, can I expect my students in my class to do with data? What skills and thought-processes can I help them develop as they learn about subject content?
A Table of Building Blocks
To investigate these questions, we compiled a table of skills and concepts that are involved in initial stages of building data literacy. The table suggests skills and ways of thinking about data that students in grades K through 12 might learn and start to use.
Structure of the Table
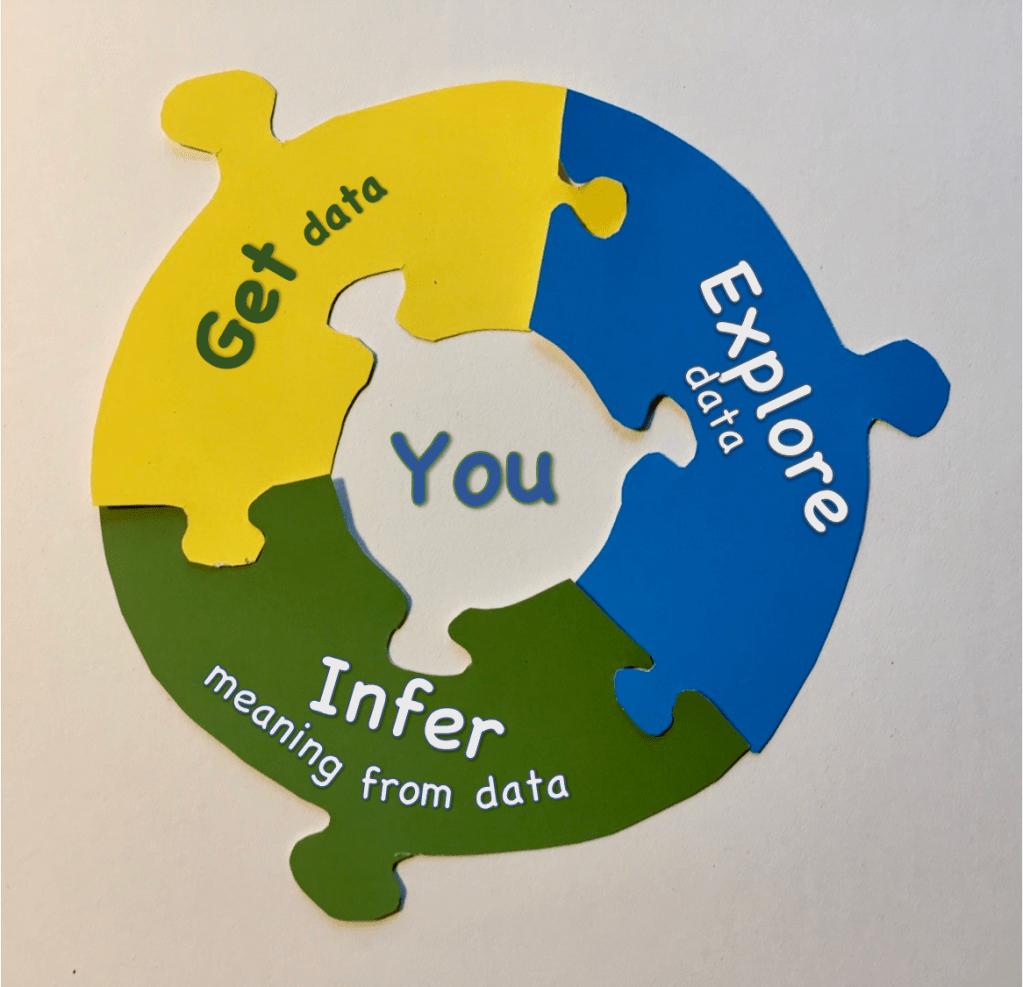
Three interconnected aspects of working with data that move investigators towards understanding and insight based on evidence are (1) generating data, (2) exploring and analyzing data, and (3) making inferences from data. The Building Blocks for Data Literacy table is organized around these three fundamental aspects of working with data. We call them realms.
Each realm is divided into several different ‘functions’, or broad components that contribute to getting, exploring, or inferring meaning from data.
Functions are further parsed into a few specific tasks. Each task describes skills and ideas to suggest how students’ thinking about data might develop as they move through K-12 grade bands 2.

The rest of the table columns designate grade bands — Grades K-2, Grades 3-5, Grade 6, Grades 7-8, Grade 9, and Grades 10-12. (Note that grades 6 and 9 have been treated separately; more about that later). Cells in the grade band columns describe examples of reasoning or skills that we propose are suitable for students in that grade band to develop and apply.
Explore the Table
Here is a link to the Building Blocks for Data Literacy table, which is in a view-only Google Sheet. The Google Sheet has five tabs at the bottom: Essential Ideas, Building Blocks Table, Keystones Map, References, and Glossary.
The Building Blocks Table itself (second worksheet tab from the left) is quite large, and may initially feel overwhelming. Moving through the following questions might help you ease into it:
1. What essential ideas about working with data are we trying to help students achieve?
- Open the Essential Ideas (first worksheet tab on the left) to review a sense of purpose and context for specific data tasks that students might undertake in a classroom.
This table summarizes the essential idea that is at the heart of each task. It shows how the tasks are associated with the Realms and Functions. The essential ideas may offer a new way of thinking about different aspects of working with data, and how parts of the process fit together in a bigger context or towards a purpose.
2. What skills and thought-processes can I help my students develop?
- Open the Building Blocks Table tab (second tab from left).
- Select a grade band that you teach (column).
Scroll down for a sense of the kinds of things students in that grade band might do, or skills they might work on within the realms of getting data, exploring data, and inferring meaning from data.
3. What kinds of data-related tasks are appropriate for students at different stages of learning?
- Select a Task (row) in the third column that interests you.
Read across the cells in that row for a sense of how skills related to that task might build over time. Each cell suggests skills or ways of thinking about data that we propose is fitting for the corresponding grade band.
4. What turning points or benchmarks in understanding can I look for?
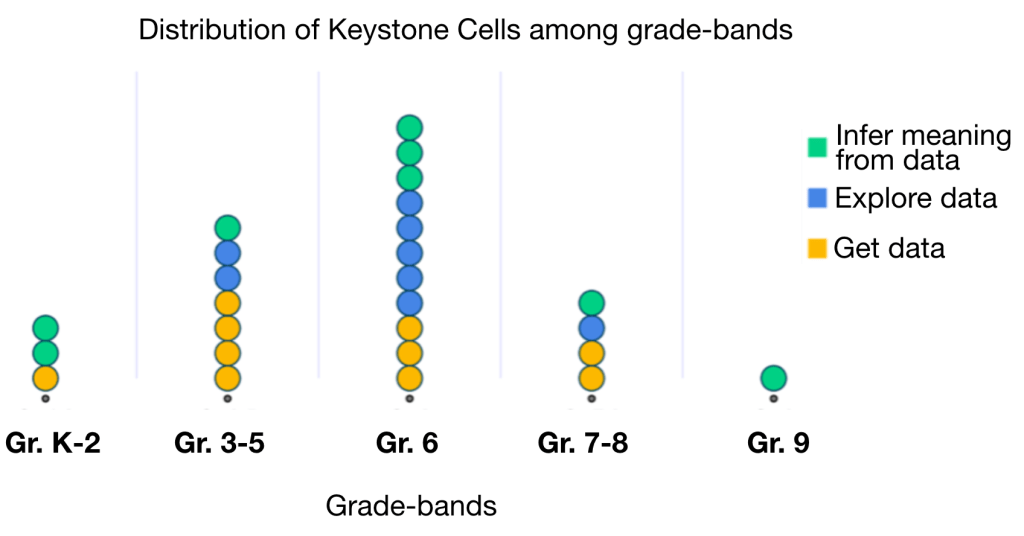
- Look at the Keystones (third worksheet tab).
In each Task row of the Building Blocks Table, one (occasionally two) cells are highlighted in a different color. These “keystone” cells contain ideas that seem to us to be crucial points of development. They involve concepts that statistics education researchers have focused on as fundamental to developing a statistical sense when reasoning about data.
Keystones are not ending points, but are turning points. They represent an important shift in how students think as they work with data.
5. Why are grade 6 and grade 9 separated from their normal grade-bands?
Grade 6 and Grade 9 seem to us as transition years for building data literacy. In Grade 6 students start to acknowledge and reason informally about data that vary, and explore questions that anticipate variability. In Grade 9 students adopt and apply more quantitative analysis tools and begin reasoning about data more formally and relationally.
Notice that most of the keystones fall in the Grade 6 band, or on either side of it. This might seem surprising, but research suggests that students can – and should – start to informally reason about data with a statistical mindset earlier than they typically have (i.e., in high school).
References and Glossary
The fourth and fifth worksheet tabs provide citations for published works that are referenced in the last column of the table (Tab 4) and explanation of selected terms used in the table (Tab 5). (*Note: the Glossary is not finished; additions are ongoing.)
What are your thoughts?
We want the table to be a tool to spark conversations and ideas for how to tackle questions such as What, exactly, can I expect my students to do with data? What skills and thought-processes can I help them develop?
Classroom teachers are the target audience for the Table, but we are also sharing it with other educators and researchers who we know are invested in the challenge of building data literacy. We would like to hear your ideas about the scope and organization of ideas in the table, the essential ideas, keystone cells, or any other aspect that makes the table useful (or not useful) to you for building data literacy in grades K-12. To what extent do contents of the Table align with your experience or expertise? How might you use it? How can it be made most useful to you?
If you have thoughts, suggestions, or questions to share, please consider completing this feedback survey: https://tinyurl.com/bbdl-feedback
In Summary
Don’t worry about absorbing the whole table or trying to teach everything in your part of the table at once. Building data literacy is a slow process that involves a significant shift in thinking for many students, and for many teachers. Allow time to absorb ideas, and to figure out which of them will enhance your content instruction, and where they might fit in best. Allow plenty of time for you and your students to adopt new ways of thinking and working with data.
But most importantly, just dive in! You might start by focusing on one or two essential ideas at a time. Engage students with data as often as possible. The nature of working with data is that once you get going, the process can start to unfold on its own. Let new ideas, new arguments and new questions arise. Go ahead, follow your nose, and see where it takes you!
_____________________________
1 See a rich body of literature about Quantitative Reasoning (Elrod, 2014; Mayes et al., 2014; Sevilla & Somers, 2007, and others.)
2 See Cobb and Moore (1997) and others who have described similar frameworks for building data skills and reasoning: Bargagliotti et al., 2020; Watson, Callingham & English, 2017; Lee & Tran, 2015; Mayes et al., 2013; Langrall & Mooney, 2002, Wild & Pfannkuch, 1999.
