
Identifying independent and dependent variables only matters when the two variables concerned have a causal relationship — a change in one variable causes the other to change, but not the other way around. For example, more turns of a wind-up band causes a model cart to travel farther. The inverse relationship, the idea that the distance a cart travels determines the number of wind-up turns, makes no sense because the wind-up turns already happened. The relationship is causal. Other relationships aren’t causal at all, for example arm span and height. Neither variable is independent or dependent, but they are correlated.
When do students need to recognize the difference between independent and dependent variables? Why is distinguishing between independent and dependent variables important?
What do the standards suggest?
Distinguishing between dependent and independent variables is introduced in Grade 6, when students first plot two numeric variables in an XY scatter plot. (6.EE: “Represent and analyze quantitative relationships between dependent and independent variables.”)
Distinguishing between correlation and causation is first mentioned in the Common Core Math Standards at the high school level, under Interpret Linear Models in the Interpreting Categorical and Quantitative Data section.
NGSS presents a different perspective. Middle school students distinguish between correlation and causation in Performance Expectations in all three middle school disciplines, and the idea is central to the Cross-Cutting Concept, Cause and Effect: “Relationships can be classified as causal or correlational, and correlation does not necessarily imply causation.” (NGSS Lead States, 2013).
Why distinguish dependent and independent variables?
It’s often emphasized that making the distinction is how you know which axis to put the two variables on: independent on X and dependent on Y by convention. But, independence, dependence, and causality may be easier for young learners to think about if they visualize the data first.
Causation is the essence of what independent and dependent relationships are, so it makes sense for students to plot the data, with either variable on either axis, to first look for evidence of a relationship. If they see a pattern that suggests relationship, they can think about whether the relationship between two variables could be causal or not, given the context of the dataset.
If they decide the relationship could be causal, they can then think about the mechanisms involved, and which variable is most likely causing the other to change. When they decide which variable is the stimulus (independent), they can swap axes if it’s not there already.
Prompts for students
Below are a few prompts to help students think about whether or not a relationship is causal, and if it is causal, which variable is the predictor and which is the response. The prompts are meant to help the students think about the data in the physical context it represents.
Picture solar panels on a roof connected by wire to a meter inside the building reading the number of amps produced by the panels. The scatter plot below shows the amount of current (amps) produced by a solar panel under different amounts of sunlight (lumens). The student (against convention) put the predictor variable on the Y-axis, but a relationship is still evident. That’s okay for now.
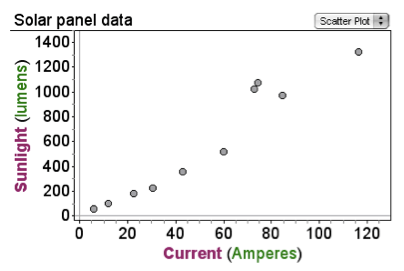
- What makes the amount of sunlight shining on the panel change?
- What most likely makes the current a panel produces change?
- Which variable most likely affects the other variable? (What will happen to sunlight if current changes? What will happen to current if sunlight changes?)
- Can one variable be used to predict how the other will change? Which one? What is your reasoning?
- What made you decide to put sunlight on the Y-axis?
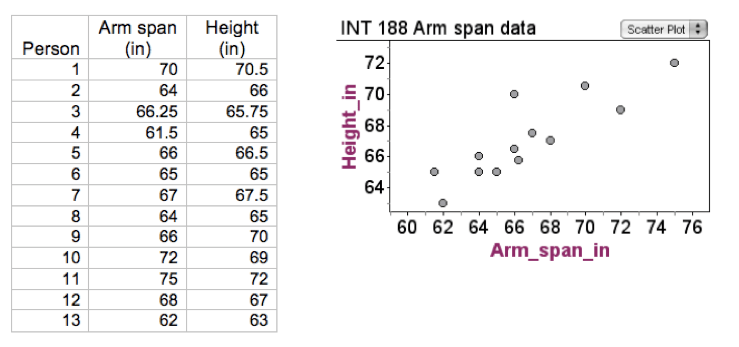
Sometimes two variables are not causal, such as the relationship between arm span and height. Neither is independent nor dependent and it doesn’t matter which axis they are on.
All of this thinking and deciding gives students something to talk or write about in the Reasoning section of their analysis and interpretation. To explain their reasoning and the relationships they find, they’ll need words to describe the kind of relationship (causal, something causes something else, or not) and, if causation is involved, words to describe the stimulus and response variables (predictor/response, independent/dependent, etc.). When they need those words may be the best time to introduce them.
Moving consideration of independent/dependent variables from the front end of graphing bivariate data to the reasoning end, when students can contemplate the data visually and in its context, could help alleviate the dependent/independent-variable brain jam many students seem to experience. It keeps the focus on the concept rather than the convention (1).
___________________________
(1) Konold, C., 2002. Teaching concepts rather than conventions. New England Journal of Mathematics, 34(2), 69-81.)

Thank you …this subyek will ne suppirt my refference of my teaching.
Agree