
When students encounter variability in data, they often assume they (or someone) has made a mistake, or that the dataset is too hard because the data are scattered and don’t tell a nice, neat story. They are used to working with values that fall neatly on a line or function, or that have an unambiguous pattern.
Here is how one student interpreted a scatter plot of fish weight vs. mercury content in muscle tissue:
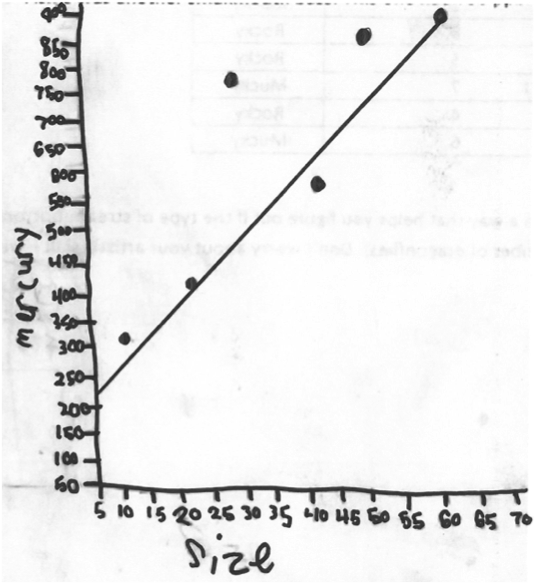
“Their hypothesis [that mercury is related to fish weight] is wrong because all the points don’t fall on the line”. — Ninth grader
The Common Core Standards for Mathematics introduce students to the concept of variability in grade six. In sixth grade students learn to plot a distribution of data along a number line using dot plots, box plots, and histograms. From there they describe the range of the distribution, its overall shape (e.g. clumped, asymmetric, spread out, bimodal), and identify its center, the mean and the median. They can learn to identify clusters, peaks, gaps, and symmetry in a distribution, and begin to reason that the more spread out (variable) a distribution is, the less well an average represents the whole group. They will soon see that the greater the variability, the harder it is to successfully predict an outcome, or to support a general statement about the population or phenomenon with certainty.
Here is a simple activity using potato chips that can introduce students to the nature of variability, using something many sixth graders will relate to. This version is adapted for the classroom by Maine middle school teacher, Bob Kumpa.
We expect variability in the world around us. Weather varies, race times vary, stars vary, and even physical properties vary under different conditions. Some kinds of things vary more than others do; variability is a property of populations and phenomena that helps us understand them. If we engage students with real-world problems and real-world data, then they need to learn how to recognize and describe variability, embrace it, and learn from it. The concept of variability is a good place to start when building data literacy.
