
 In biology, the Central Dogma describes the fundamental process by which molecular information coded in DNA in the nucleus of a cell is transcribed, translated, and transferred to the cytoplasm, where it is used to instruct the synthesis of proteins. Proteins then carry out functions throughout the body such as transport, regulation, storage, structure, communication, metabolism, repair, and other actions that keep us alive and healthy. That sounds a lot like what happens when someone analyzes and interprets a collection of data and reports findings to peers or a community, who then follow through with informed action.
Observations (measurements) of a real phenomenon or event are systematically recorded, the values are analyzed for patterns and translated to develop new ideas and understanding, and the meaning and potential implications of those ideas are transferred to an audience who can act on the new information (and raise new questions).
But, differently, the process of translating data into useful information is limited by one very serious constraint: the things we want to measure and understand, such as diseases, weather, economic factors, are usually too far-reaching to be able to measure every aspect or part of it. We have to have a way to learn about the whole picture — such as how many individuals are infected by the SARS-CoV-2 virus — from just a sample.
The fundamental challenge to deriving accurate (and thus useful) information from data is clear in the following example: Suppose we want to know how many people in the world have been infected with the Covid virus. (That would help us know how many masks to distribute or vaccines to make). There is no way to test everyone, much less test everyone regularly over time. Various countries, states, and organizations are collecting data, and here is what ten of them report today (September 15) at noon:
Below is the distribution of global cumulative cases (column B) as of today, shown in a dot plot. Here is the link to the dataset in Tuva, if you or your students would like to play with it.
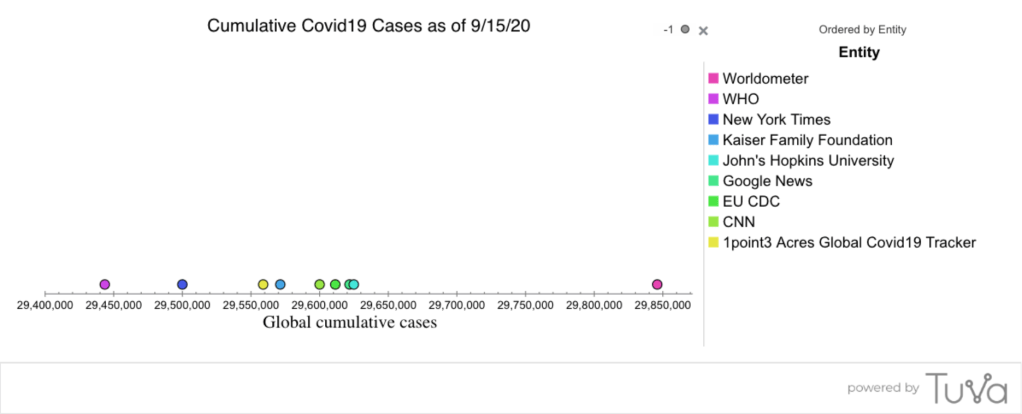
The ten sources of data all suggest a different number of global cases of Covid-19 as of noon today. The values might be different because they are updated at different times, or because different methods (or different criteria) were used to determine who is infected, or because the number of people infected is changing too fast relative to methods used to document cases, or a combination of these or other explanations. We know that not everyone was tested and that the cases counted represent a sampling of the global population and a sampling of those who are infected. While the values in the dataset give us a probable range, we can’t say with certainty or precision how many individuals have been infected with Covid-19. We can’t say which of these values is closest to the truth; we don’t even know how well the average of these ten values represents the truth. Nevertheless, the values do give a useful, if uncertain, idea of the situation, and some relative numbers that can be tracked over time.
The “Central Dogma” for data is this: A collection of observations of a population or phenomenon is recorded, graphed, analyzed, and interpreted to glean useful information — just as amino acid sequences in DNA are transcribed, translated, and transferred to the cytoplasm to inform the creation of proteins. But when every case cannot be measured, the collection of observations (data) is an incomplete representation of the whole population or phenomenon, thereby introducing some degree of uncertainty into interpretation and inference.
Fundamental to using data well is being able to think about why, in a particular context, data might vary, and to recognize the potential for uncertainty in making claims and inferences about those data. Variability is what makes decisions in the face of uncertainty so difficult, yet necessary because we can’t measure everything, everywhere, all the time.
As science, math, and social science educators, how can we help students understand the reason for — and work with the implications of — uncertainty in data? I put this out to every teacher to consider. Once students “get” the central problem of gleaning useful information from a sample that is variable, amidst some degree of uncertainty, the door is open for them to organically reason, argue, refine, and delve deeper into data to harden their evidence to justify claims and decisions they make.
